Help
this page will help you search regions of your interest and understand the results of the database.
Rhythmicity analysis for circadian c-Fos expression
Rhythmicity for regions of interest (Home)
Users can search regions from query forms about rhythmicity, 2D/3D slice viewer and anatomical tree.
Rhythmicity tab: Users can look for regions from candidates in "candidates" text box filtered by the anatomical level, peak time range and cutoff value for p value or FDR.
Slice viewer tab: Users can select regions from 2D slice planes created from a 3D point cloud image of the whole brain.
Anatomical tree tab: Users can select regions by clicking a region name. Clicking a checkbox in the left of a region name expands child regions belonging to a parent region.
Users can select multiple regions by the methods above. Users also directly select a region of interest in the search box.
Figure types
Line plot: line plots for circadian changes of c-Fos positive cell counts in selected regions.
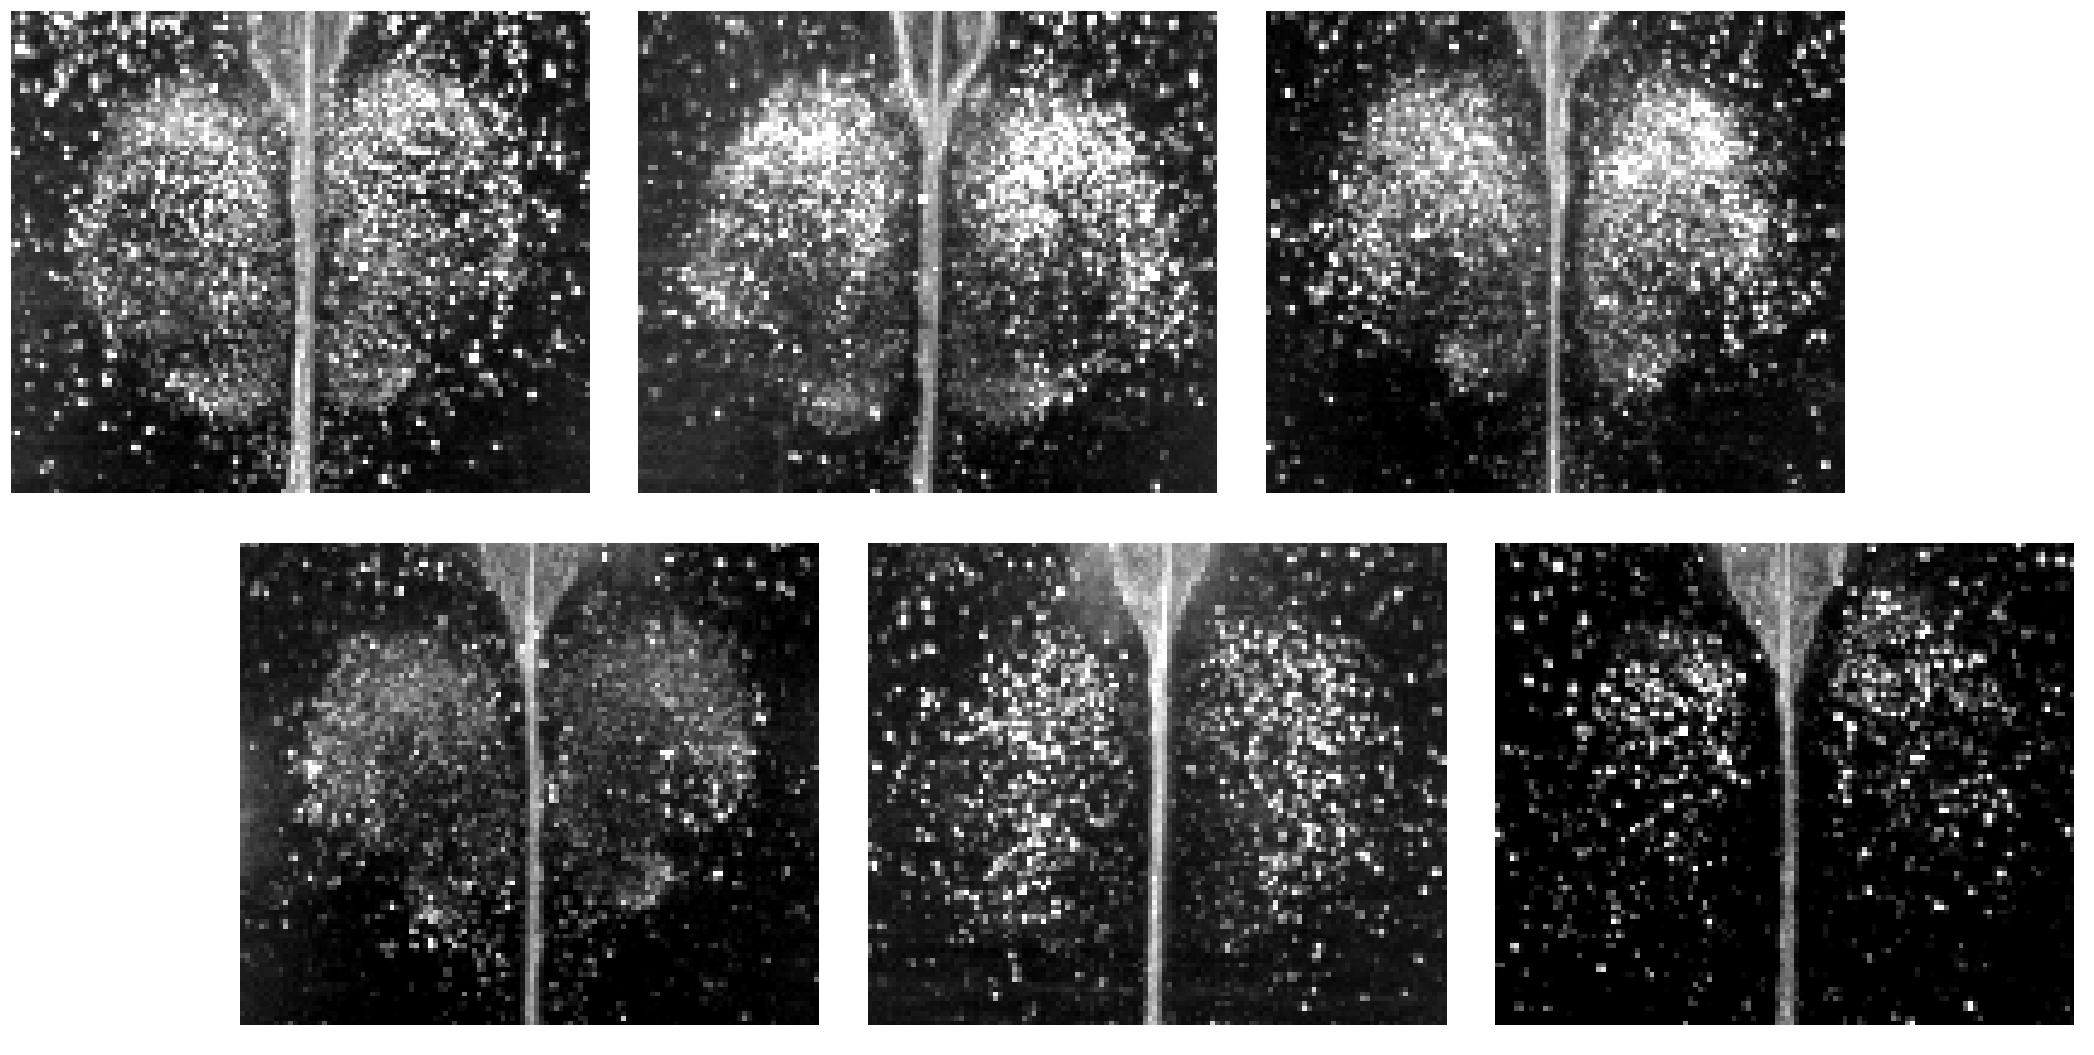
Time-series image: circadian changes of projected normalized images for selected regions with surrounding areas and line plots for circadian changes of c-Fos positive cell counts in selected regions. Opaque and translucent white outlines denote the region of interest and its surrounding regions. Regions are sliced through their centroid.
Movie and Voxel-wise peak time: GIF movie created by images for selected regions with surrounding areas and voxel-wise rhythmicity analysis at 20-um voxel scale corresponding to GIF movies.
Peak-time (Phase) in the whole-brain slice (Whole brain slice)
Users can see the brain map of peak times of c-Fos circadian expression at the regional or subregional (20-um voxel) level. Users can select characteristics of figures in the right radio buttons. Count ratio means the results of rhythmicity analysis based on the c-Fos positice cell counts in the region or voxel divided by the total c-Fos positive cell counts in the whole brain. A Upper figure shows the peak times in the slices of a whole brain. A lower figure shows the subregional peak times in the slices of the region of interest.
Peak time (Phase) of the user-defined areas (Advanced)
Users can know peak times of the areas they defined. A user-defined areas that will be uploaded sholud be represented by 0 or 1 in 50-um scale CUBIC-R+ atlas space (243 x 440 x 339 pixels for z y x axis) as TIFF file format. Users can upload multiple files of user-defined areas, however the total file sizes shouldn't be more than 500 MB.The uploades files will be deleted after rhythmicity analysis or 2hr after uploading.
The results of figures and movies shown on the screen can be downloaded by clicking the icon on the right upper side of the objects.

